



At a congressional oversight hearing last week, FBI Director Kash Patel touted an incredible list of accomplishments during his tenure.
Among those was this: “When you arrest 54,000 violent felons – the FBI alone – a 90% increase in just 18 months, that’s making America more safe than it’s ever been before.”
That number – 54,000 – jumped out at me.
(His use of the word “felons” for those who have only been charged with crimes also jumped out at me. DOJ still reminds the public in nearly every press release that defendants are presumed innocent unless and until proven guilty beyond a reasonable doubt in a court of law. But that’s a discussion for another day.)
As a longtime DOJ spokesperson, I have worked with reporters for years on stories that compare trends in the department’s enforcement priorities. I know the stats well.
Fifty-four thousand defendants (not felons) charged in cases referred by the FBI in 18 months would be a remarkable feat, especially since he claims to not be counting all arrests, just those accused of engaging in violent offenses.
According to DOJ’s annual statistical reports, over the past 10 years the department has charged 72,500 defendants on average each year. The FBI is the referring agency, on average, for 12,000, or about 16% of all defendants charged.
Judging by this historical record, the expected number would be around 18,000 for 18 months – which makes the FBI Director’s 54,000 number not seem credible to me. But it’s very difficult to check real-time stats like this from DOJ’s leadership.
You can get data from the annual statistical reports, but the report is typically released six months or more after the close of each fiscal year. For example, the report for Fiscal Year 2025, which ended on September 30, 2025, was released in June 2026.
If you want to see what’s happening within the past year, you can get monthly data that the Executive Office of U.S. Attorneys (EOUSA) publishes regularly, one of the department’s proactive disclosures in response to a FOIA request.
But DOJ makes accessing that data extremely difficult. Here’s what you get when you download the files:
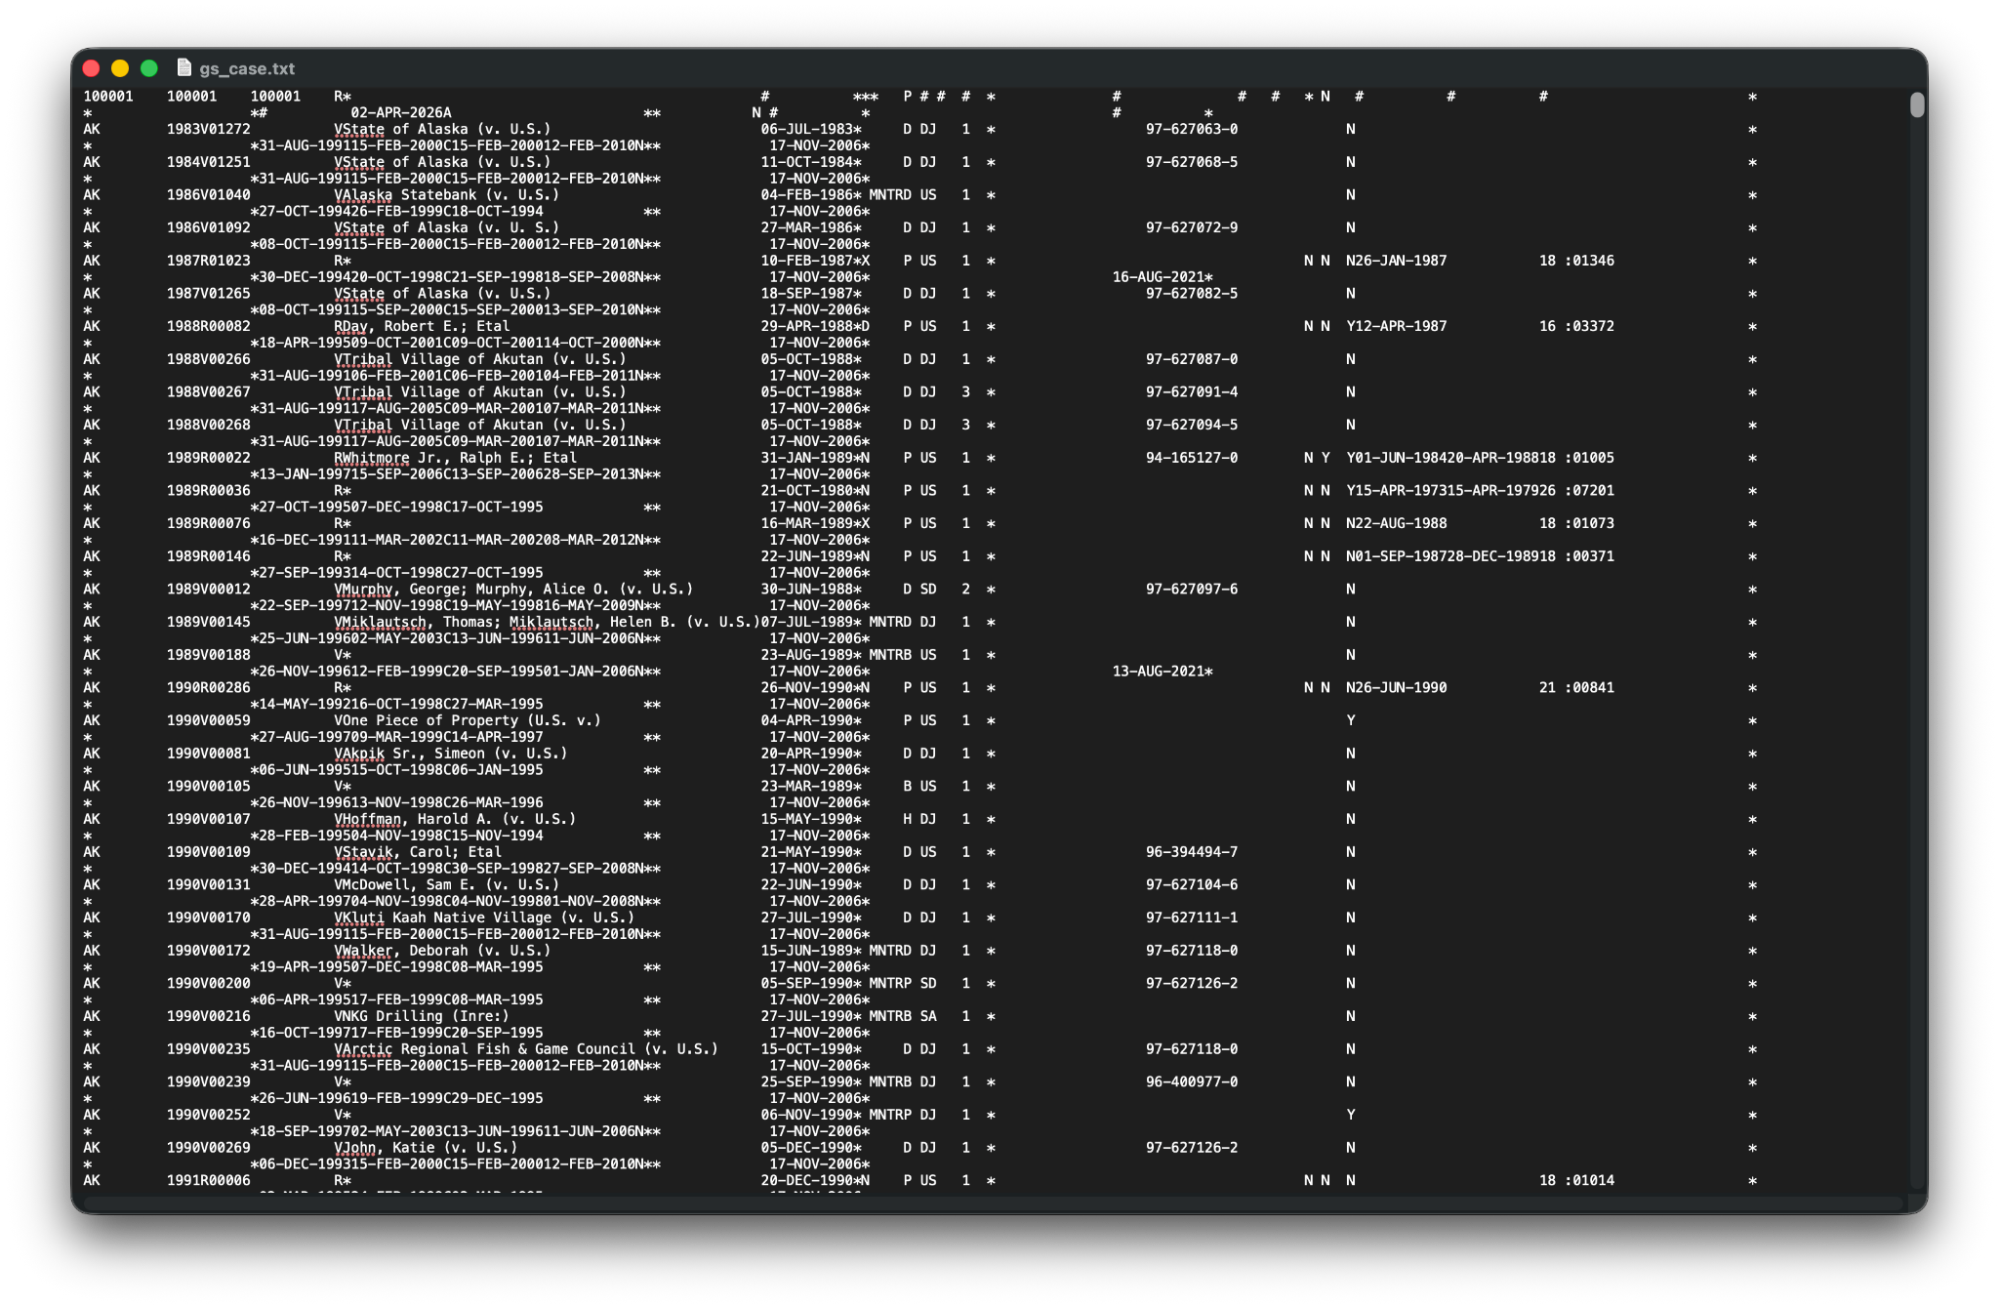
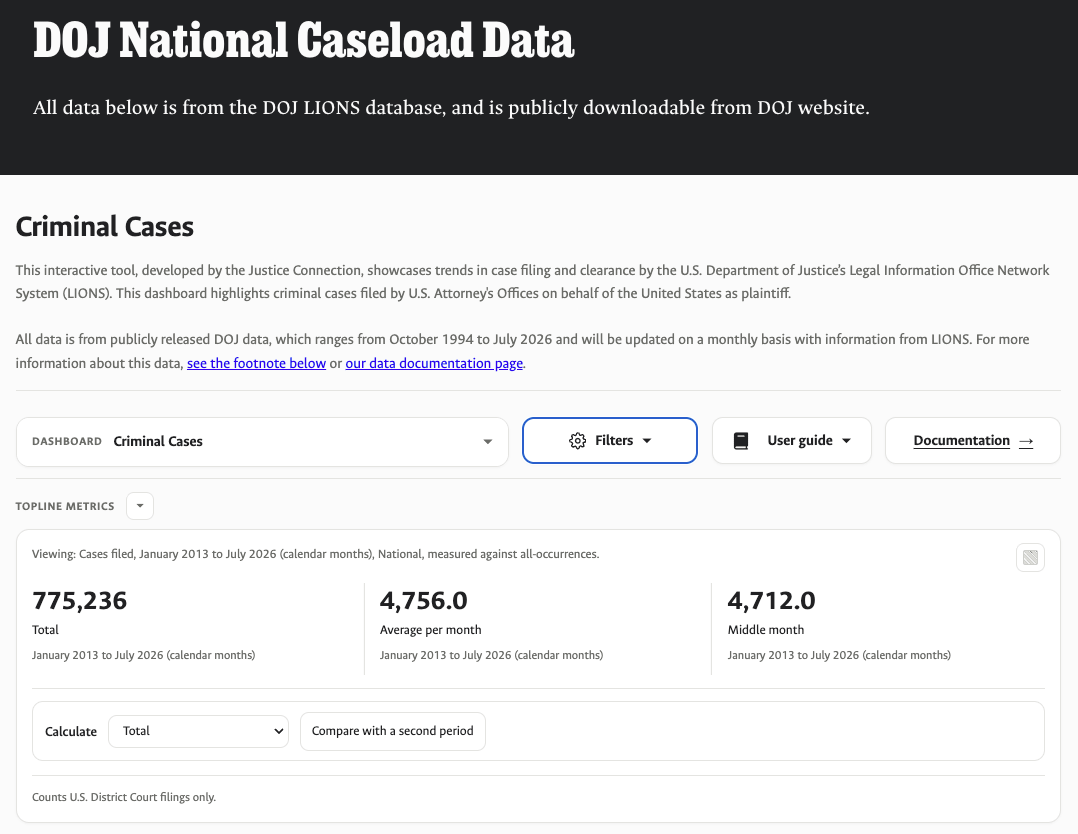
Rather than settle for muddy data, our team at Justice Connection has spent the past few months building several online dashboards to make this data accessible and understandable. Now, anyone who wants to get a better picture of how changes in enforcement policies are affecting U.S. Attorney’s Offices throughout the country can do so.
The DOJ National Caseload Data page on our website gives immediate access to criminal and civil caseload data, and allows you to parse that data in a myriad of ways. We structured the dashboards to show similar data tables that you can find in the annual statistical reports, including all of the criminal program categories, civil causes of action, referrals from federal agencies, and reasons for case declinations.
Our goal with this project is to allow alumni, journalists, congressional staffers, and researchers to quickly assess claims made by department leadership or see how increased enforcement in one area may be affecting others.
Let’s go back to Director Patel’s claim of 54,000 arrests for a moment.
According to EOUSA data visualized through our dashboards, the FBI referred 17,736 defendants in all criminal cases – not just violent crime cases – in the last 18 months under Patel’s leadership, not 54,000. If you look at the 18 months before his tenure, the FBI had referred 18,603 defendants for federal prosecution.
According to the department’s own statistics, the FBI is accounting for fewer people getting charged in federal courts than the previous 18 months, not a 90% increase.
It may be that there is a justifiable explanation. For example, Director Patel may claim he is merely citing arrests, not referrals that result in a federal prosecution. If that is the case, then it raises another question: Why are more than 67% of the FBI’s arrests not leading to a federal prosecution?
These referral stats are the only metric the department releases that shows the FBI’s involvement in the cases U.S. Attorney’s Offices bring throughout the country. Making this recent data accessible to the public is one way to raise questions like these for the FBI to provide greater transparency to the statistics they are claiming.
The dashboards are good tools for doing a quick check on claims like this, or to spot high-level trends or outliers.
But, if you want to do a deeper dive in the cases behind the numbers, we created the Case Look-Up tool. This gives you the ability to create a targeted search using a wide range of factors and then pull up the individual case information, which you can download in an easy-to-use format for further analysis.
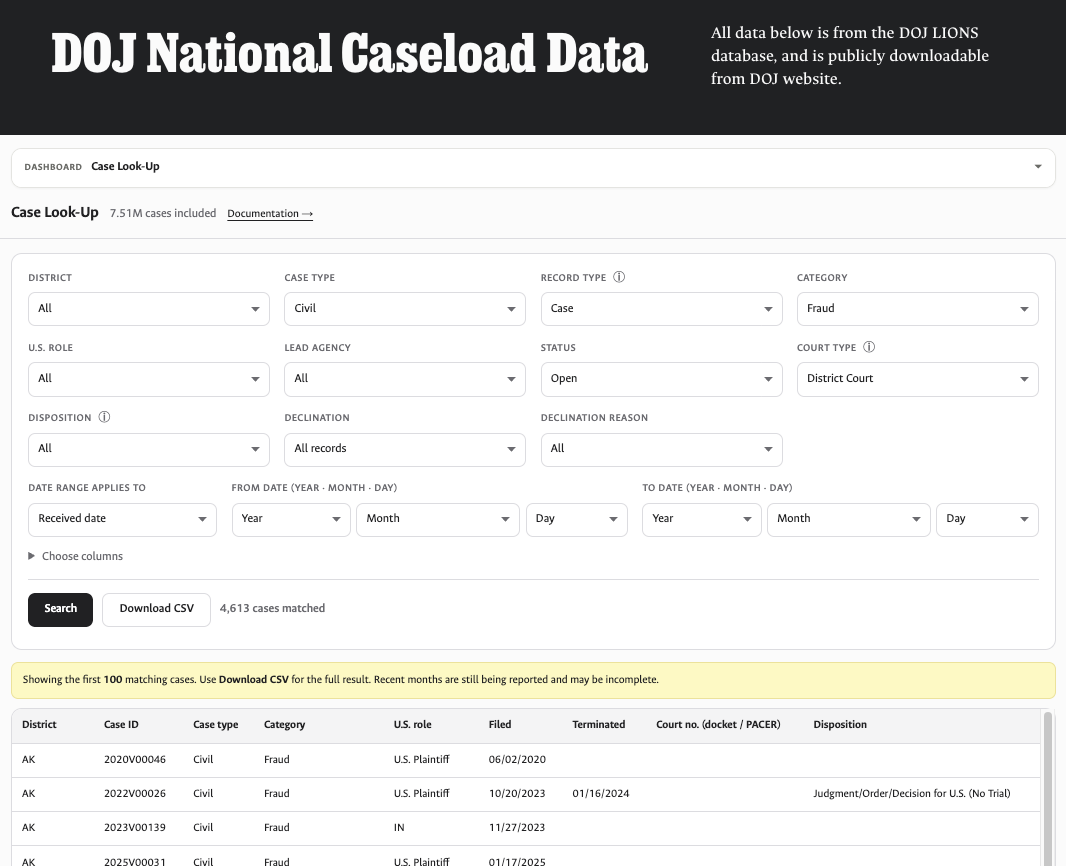
We encourage everyone who reads our Substack to devote some time to exploring the data. Over the next few weeks, we will feature posts from alumni who will share what they found.
For the alumni in our audience, we hope that if you spot something in the data that you think demands attention, you’ll consider reaching out to us to share your findings and potentially write a future post for our Substack.
For the journalists, researchers, and congressional staffers in our audience, we hope that this tool will give you ideas about ways to better cover the department and, when necessary, hold it to account.
And we hope this data project will encourage more transparency from the department about the data behind the statistics they release.
Justice Connection will continue to do our own analysis of the data while designing new features for our dashboards that will make it easier to use. If you’re interested in following along with our updates, please click on this link to sign up.
Exhausting work for you and an exhaustive list!
This is a critical public service to expose the lies from President Trump, Attorney General Todd Blanche, and FBI Director Kash Patel. Thanks Justice Connection!